OFFER AND DEMAND
OFFER AND DEMAND

Both supply and demand are highly relevant, used and analyzed concepts in all parts of the world, either by companies that want to sell their products or services, or by individuals seeking to meet certain needs. That is why it is interesting to learn about this topic, since it involves everyone on the planet.
DEMAND is the amount of a good that an individual needs to meet their needs at a certain price and it is important to clarify that only the buyers use this concept.
The price of a good or service plays an important role within the demand of the individual since if no other factor changes and the price rises, it will tend to decrease its demand on it. If the price decreases will tend to happen the opposite. For example, if the price of pears rises and there are no changes such as the price of other related foods (apples, oranges, bananas, etc.) or consumer income, they will tend to demand fewer pears.
This phenomenon fulfills an inverse or negative relationship to what is called the LAW OF DEMAND.
Below we will see a graph that exemplifies the law of the demand, we will call it "curve of demand":
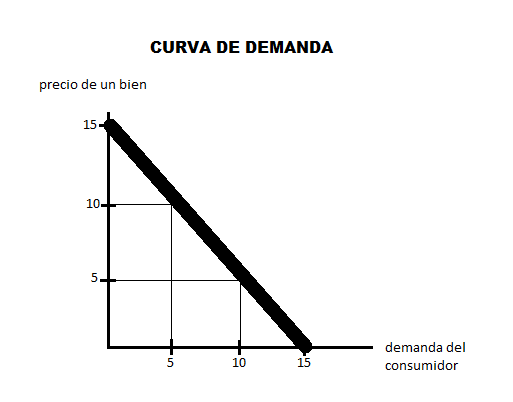
It can be observed that in the axis of the ordinates is the price of the good, whereas in the abscissa the quantity demanded by the consumer is presented. When the price increases the demand decreases, however when the price low the demand grows. However, there are countless different demand curves, since this depends on the good it represents. There are goods that increase the price of their demand varies less, while other goods have a greater alteration. This variation is known as ELASTICITY. It is said that when one good has greater alterations than another In its demand in the face of a price change, it is more elastic. Just as in economic markets there is demand, defined as the amount of goods or services that a person or many need to satisfy their needs, there is also the OFFER, which is the quantity of goods or services that instead of being demanded, Are offered depending on how much they can and want to create the producers. We can then say that demand depends on supply and on a reciprocal basis. As in the demand, the supply of goods and services is linked to several factors. For example, if there are no significant changes for the producer (such as wages, input prices or raw materials, etc.) and decide to raise the prices of their products, their profitability or profit will be higher. Here we present the LAW OF THE OFFER which, in a conceptual way, is the proportional relationship between the price of the good and the quantity offered. It can be seen in the graph:
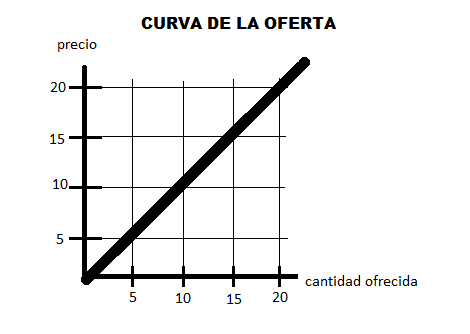
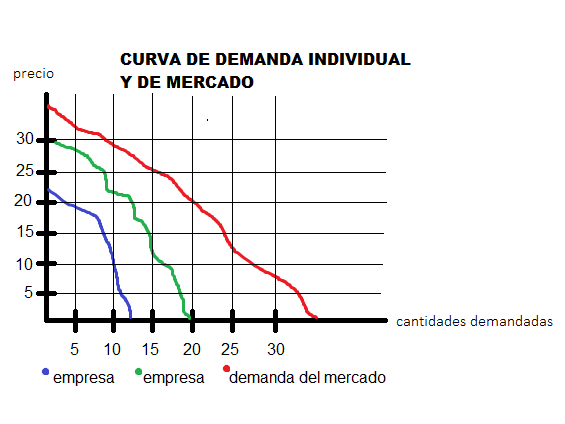
Elasticity can also occur in the supply curve, and there are also elasticities of different magnitudes. If a small change occurs in the price of a good, a larger or smaller variation may occur in the quantities produced. Another interesting factor can be presented in the supply, the time. This has a different influence on business (depending on what is going to be produced or quantity, etc). For example, if an increase in the price of soybeans is generated, we could say that the quantities sold will go up and thus, the owner would gain greater profits. However, this is not going to happen immediately since soy production takes time to produce, meaning that the company will have to find out how the price increase will be maintained until the new quantities of soybeans are demanded. OFFER AND DEMAND IN THE MARKETS Previously, two essential concepts, supply and demand, were analyzed. However, we have not studied how they relate to the market. In the following chart we will see supply and demand in the markets:
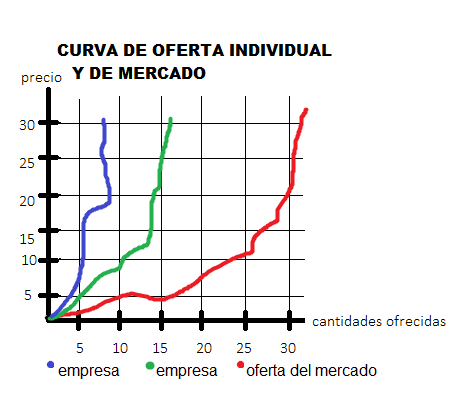
When these concepts are compatible, it is said that demand and supply have a balance in the market. For example, suppose you have a company that produces pears at $ 15 each and can produce at most 50 per month. If the company sells 40, could we say that there is a balance? The answer is yes, since the price of the product is accepted by the customers demanding an amount that comes close to the maximum production of the company. Perhaps the company has a cost of 45 pears so that there are no losses, but equally there is a balance in the market.
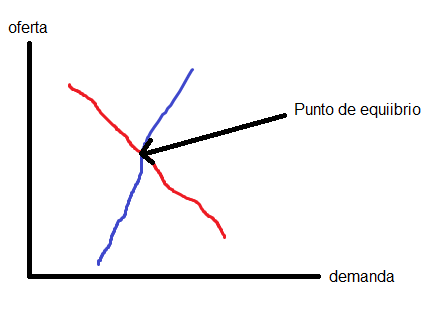
In the graph of supply and demand, which is the price as a function of the quantities of the good, we can observe an equilibrium when both curves are cut.
This is a graph that shows a balance:
Although these are very basic concepts within the economy, they are very important today, since they are the basic within the global economic market.


Comments
Post a Comment